Toolbars
The Report Controls, Report Layout, and Color Palette toolbars will be docked at the top of your Report Designer screen by default. It is easiest if you leave the toolbars docked at the top of the screen. Toolbars may be reshaped and moved. To move a toolbar that is not docked, click on the colored top portion (with the toolbar name) and drag it to the desired location. To dock a toolbar, drag it to the top of the screen so it turns into a horizontal rectangle with a thin border and let go of the mouse. If a toolbar does not appear on the screen, you can select it from the View menu.
You will find you use Report Controls and Layout all of the time, and they are the ones you want to have displayed on your screen. The Report Controls toolbar contains all the functions for adding and changing items including text, fields from your catalog, lines and images. The Layout toolbar enables you to organize those items. These two toolbars are explained in detail below. A Report Designer toolbar is also available, but you will not need to use it as its functions can be accessed from the drop-down menus.
Report Controls Toolbar
Below are descriptions for each tool.
Report Controls Toolbar
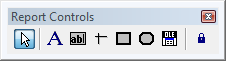
 Select Objects/Selection tool - This is the default tool on the toolbar. It allows you to use the mouse to select items on the report. When you are finished changing selected objects, click this arrow button to deselect them.
 Label - To add or edit text in your report, such as a title, field label or column heading, first click on the Label tool. Next, click where you want to add or edit text. Once you see the flashing cursor, begin typing the text.
 Field - To add a new field to your report, first click the Field tool. Your mouse will turn into a plus sign. Next, click where you want the field to appear and hold your mouse button down. Start drawing a box with your mouse, and when you release the mouse, the Report Expression screen will appear. The Report Expression screen is described in detail below. In the Expression line, enter the field name for the field you want to add to the report. When you have entered the field name and chosen the desired settings, please click OK. On the report, you will see the field name in a box. This field box pulls data from the database(s) you selected when you chose a Report Type.
 Line - To draw a line in your report, first click the Line tool. Next, position the cursor where you want the end of the line to be, click and hold your mouse button and drag until the line is the desired length, and then release the mouse button. You may draw horizontal and vertical lines.
 Rectangle - To draw a rectangle in your report, click the Rectangle tool. Next, position the cursor where you want a corner of the box to be, click and hold your mouse button, drag until the box is the desired size, and then release the mouse button.
 Rounded Rectangle - To draw a rectangle with rounded corners in your report, first click the Rounded Rectangle tool. Next, position the cursor where you want a corner of the rounded rectangle to be, click and hold your mouse button, and drag until the rounded rectangle is the desired size. To indicate how rounded your rectangle should be, double click on the Rounded Rectangle object to open the Round Rectangle screen where you can pick the shape of the rounded rectangle, from slightly rounded to completely oval. An oval shape can be resized to become a circle.
 Picture/OLE Bound Control - Use this feature to insert an image in the report. Report images must be in BMP, JPG, GIF, PNG or TIF format. If you have your logo or letterhead as an image file, use this tool to put it on the report.
 Button Lock - Used to make one of the tools the "default" tool when inserting items into a report. If you plan to use a tool multiple times, you can use Button Lock to save you from clicking the tool every time you need it. Click the Button Lock again or the Selection tool to unlock this function.
Quick Tips for Item Selection, Resizing and Placement
- Click on an item to select it.
- Click and hold down your mouse so you see a pointing hand, then drag the dotted line box around several items to select them as a set.
- Shift click on multiple items to select them as a set. To do this, please hold down the Shift key while using the mouse to click on multiple items.
- When items are selected, you can move them with the mouse or the arrow keys on the keyboard. You may also resize them using your mouse or by holding the Shift key down and using your arrow keys.
- When multiple items are selected, you can resize them together by holding down the Shift key and pressing the arrow keys.
- Double click on items to open screens that let you change their attributes.
- When you are finished changing selected items, click the Select Objects/Selection tool on the Report Controls toolbar to deselect them.
- To adjust the vertical and horizontal location of an item, click on the item and, using the left mouse button, drag it up or down. You can also click on the item once to select it, then press the keyboard arrow keys to move it.
The Report Expression Screen
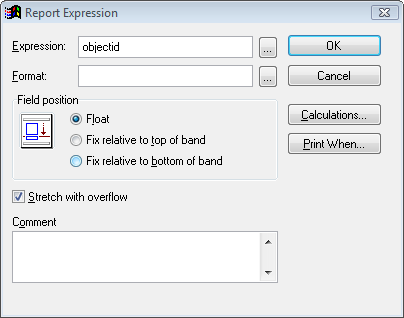
When adding a new field to the report, use the Field tool, as described above. This will open the Report Expression screen as seen below. This screen can also be used to change an existing item's attributes. To open the Report Expression screen for an existing item, double click on the field.
Report Expression screen
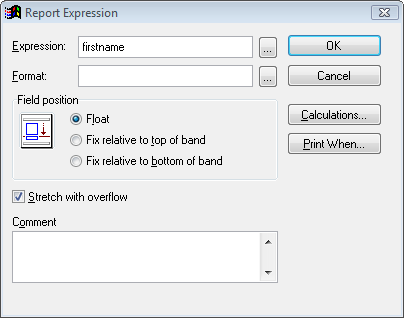
For most reports, you can add any field that is contained in the database on which the report is based. For a list of available fields, please review the Field Descriptions reports from the Reports menu. The field name that you enter in the report expression is not always identical to the field label on the data entry screen. When viewing the Field Descriptions report, the field name comes after the paragraph, inside square brackets before the colon. For instance, "objname" is the field name in [OBJNAME: c(40)]. To add the Object Name field to the report, type objname in the Expression line. If a field name is added to a report that is misspelled or not contained in the underlying data file or query, the report will produce errors.
You may enter one or more field names in an Expression line. If you want to pull multiple data fields into one field box, you will separate the field names with a comma or semicolon with NO spaces. If you use a comma, the fields will appear with one space between them in the report. When using a semicolon, a carriage return will appear between fields.
Example: If you had a Contacts report where you wanted the first column with the contact ID#, a second column with contacts' first and last names, a third column with the last donation date, a fourth column with the last donation amount, and a fifth column with both the home and cell phone numbers, you would insert field boxes. You can place the fields first name and last name together, separated by a comma in one box like this: firstname,lastname.
Report Expression screen
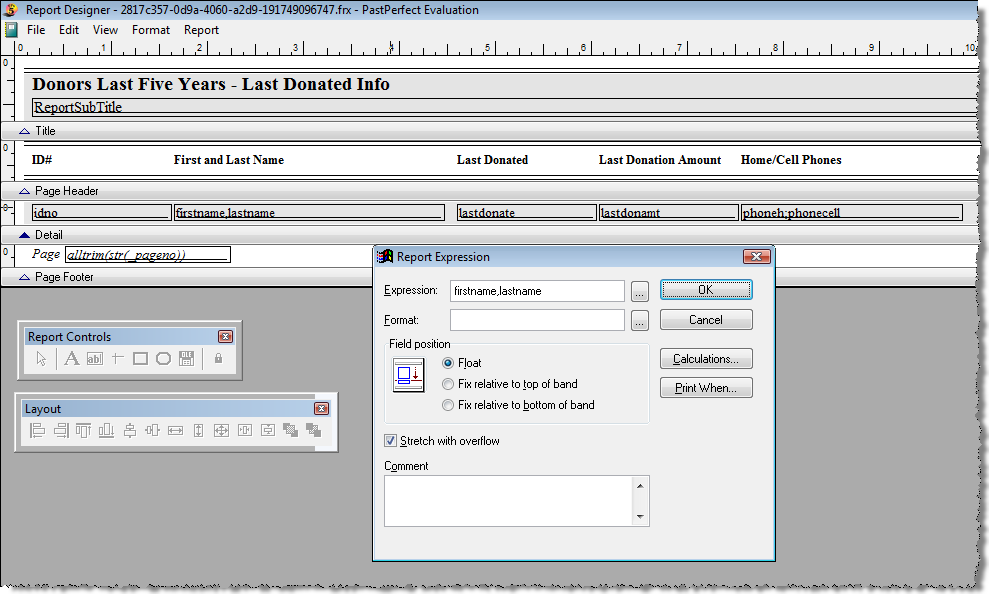
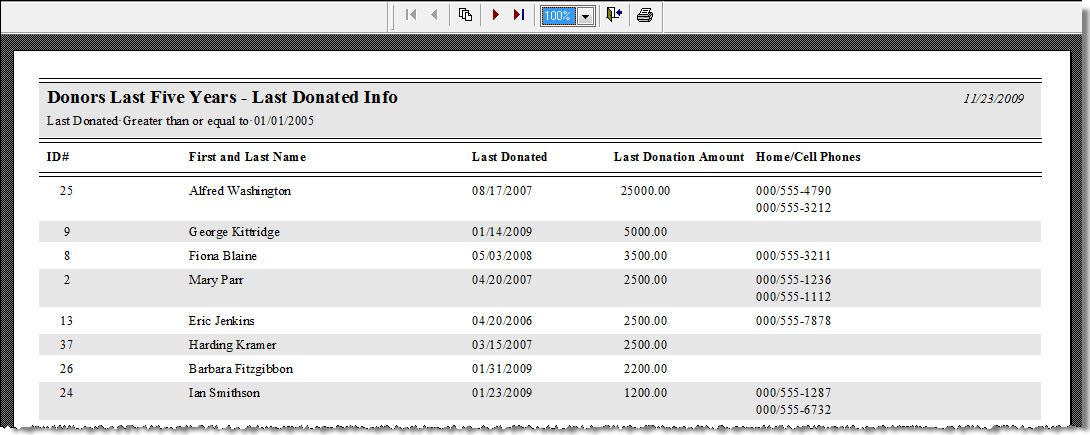
They will appear in one column as shown below. You also want the telephone numbers in a single column, but want home phone to appear above the cell number. You can achieve this by entering phoneh;phonecell in the Expression.
Preview of report
Using the Format option on the Report Expression screen, you can left, right or center justify data in a field box. For instance, if you include a field like amount paid (which represents a monetary value), you may want to right justify the numbers on the report. You can do that by clicking the Browse button (button with three dots) to the right of Format, unchecking Left Justify, and selecting Right Justify. Click OK.
In the Field Position section of the dialog screen, you can set whether an item is fixed to a point in the report or floating relative to other items. You generally want to use Float when you have Stretch with overflow selected. If the data in one field may stretch to multiple lines, as is often the case with unlimited memo fields, you will want other fields and text to move up or down, rather than being overwritten. For instance, your object descriptions may be several paragraphs or just a sentence. You would use Stretch with overflow to allow one field expression box (descrip) to accommodate different description lengths. You would then also set the description field box and other field boxes and text labels around it to Float. This way the position of the items accommodate longer and shorter descriptions.
When you place a field on the report you should adjust its size to the minimum required, not the maximum. Using Stretch with overflow enables you to compensate, so that all data appears on the report, even if the field expression box does not seem large enough. Data will flow to additional lines.
TIP: Some reports are set up as labels, such as catalog cards, catalog record labels, and contacts mailing labels. Working in the Label Designer screen is just like using Report Designer; however, your fields, labels, lines, etc. must have a fixed field position due to the limited size of labels. It is also important to note that fields on labels may not be set to Stretch with overflow. They will have a fixed size.
With the Calculations tool, you can count the number of records or get a sum of values on reports. Many of the predefined reports show a count of the records or contain total values. However, you can add these to any report by inserting a Summary band, copying a field, and setting the Calculations.
Counting Records on a Report
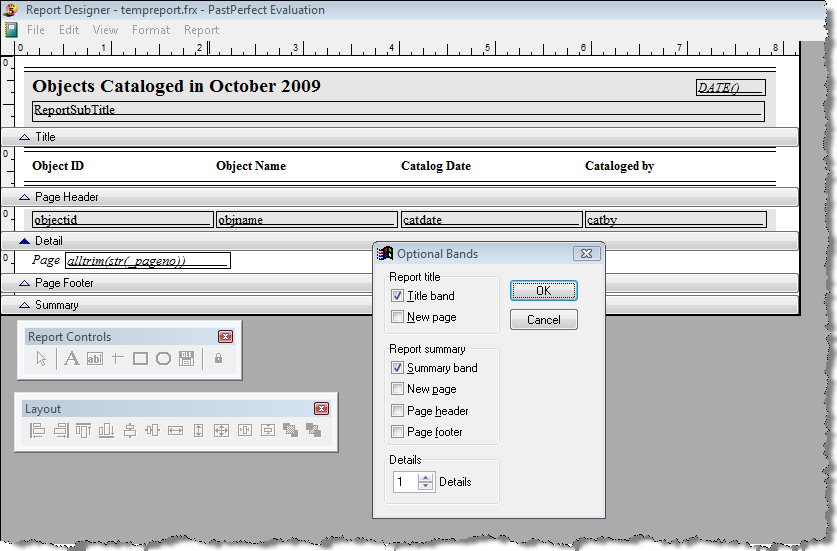
To count the number of records on a report and place the total at the end of the report, first go to the Report drop-down menu at the top of the Report Designer screen. Choose Optional Bands and check Summary band, seen below. Click OK.
Optional Bands screen
Since there is one Object ID field for each record, you can count the number of its instances to get a total number of records. Select the objectid field and go to the Edit menu. Choose the Copy option. Then choose Paste. Using your mouse, move the second objectid field box down to the Summary band.
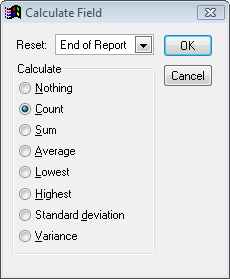
Double click on the objectid field to display the Report Expression screen then click Calculations. Select Count and click OK twice to exit the Report Expression screen.
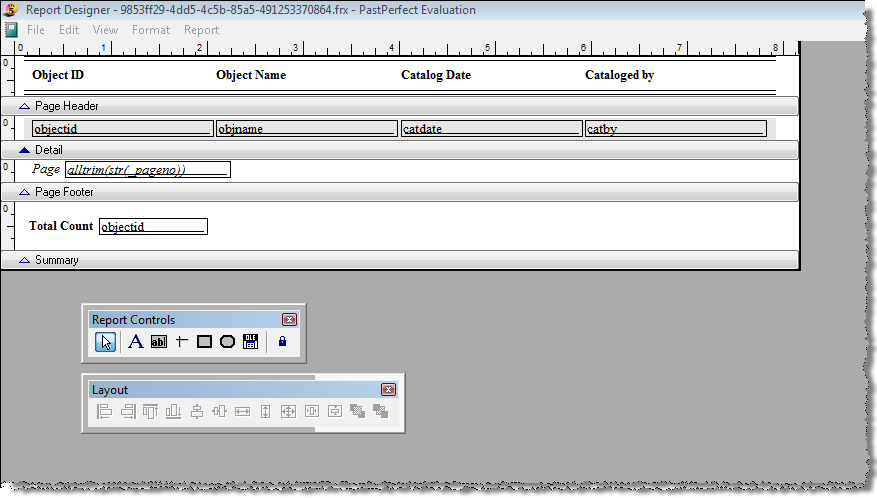
The total number of records will appear in this field box on the last page of the report. You may want to use the Format drop-down menu and choose Font to make this box bold. You can also use the Label tool to add text to explain this number.
Report with objectid in Summary band
Summing Values on a Report
When choosing a field to sum, please keep in mind it needs to be a numeric field to perform the calculation. Generally numeric fields, such as objects' acquired values or insured values or contacts' donations, dues, or in-kind gift amounts, are the fields that you want to sum. To get a total value on a report, start the same way as counting records, by creating a Summary band. Then, similar to counting records, select the field you want to sum, and copy the value or amount field and paste the copy into the Summary band. This is where the total value will appear at the end of your report. Double click on the field box and click Calculations. Choose Sum, as seen below, and click OK twice.

Print When Statements
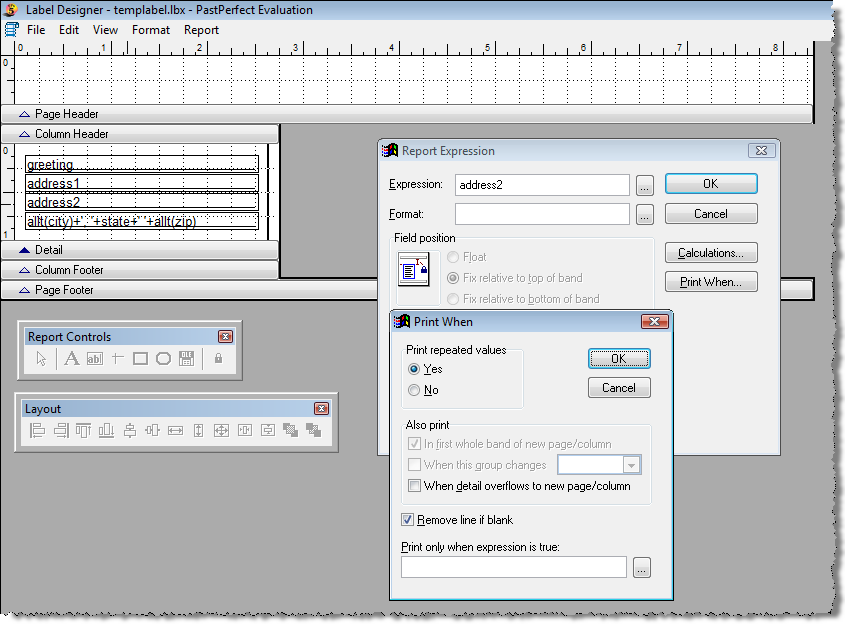
The Print When function allows you to remove a line if no data exists in that field or print data only if a condition is met. One of the most common uses is in address labels. Some contacts may have two address lines, so you want to add both the Address1 and Address2 fields. However, you do not want an empty line if no data exists in the Address2 field. To eliminate the empty line, double click on the address2 field box. Click Print When, then check Remove line if blank.
Click OK, then OK again to exit the Report Expression screen. Now when printing a list of contacts labels, the city, state and zip code line slides up beneath Address 1, when no data exists in the Address 2 field.
Calculate Field screen, Sum selected
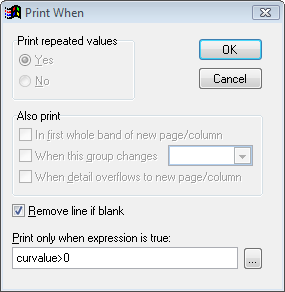
Print When may also be useful if you use numeric fields and want the data to print only if the amount is greater than zero. Double click on the field containing the data you want to restrict, then click on Print When. In the Print only when expression is true box, enter the field name, the greater than sign and zero. For example, if you wanted to print only the current minimum values for items with values greater than zero, you would enter the following. curvalue>0
Print When screen with expression
Then click OK twice to get back to the Report Designer screen.
The Layout Toolbar
The Layout toolbar can be quite helpful to ensure that items on the report are properly aligned or centered. For example, to be sure that the left edge of multiple items are aligned, select the items with the Selection tool and click the Align Left Sides button.
Layout Toolbar
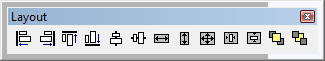
The Layout toolbar has 12 other tools, including Align Right Sides, Align Top Edges, Align Bottom Edges, Align Vertical Centers, Align Horizontal Centers, Stretch to Same Width, Same Height, Same Size, Center Vertically, Center Horizontally, Move to Front, and Move to Back.